Appearance
Java Memory Management and Garbage Collection
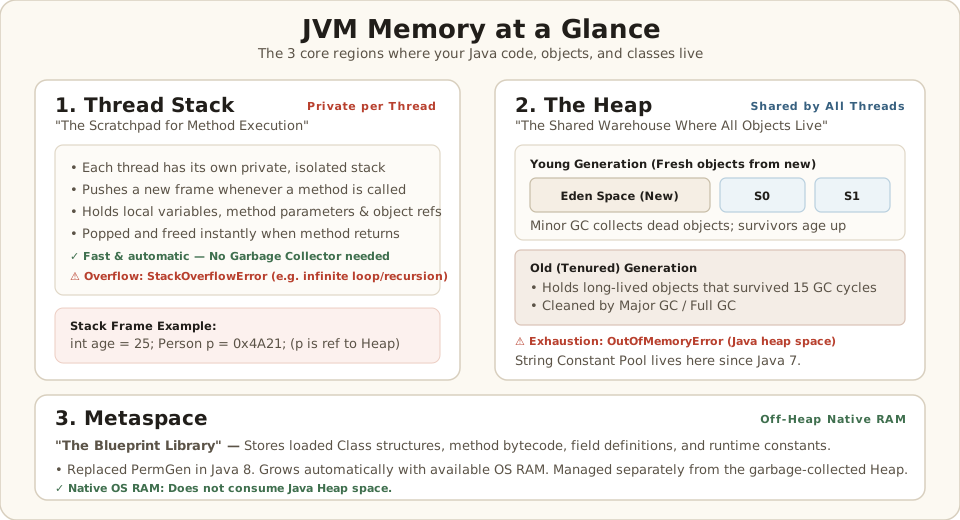
Why Every Java Developer Needs to Understand Memory
When you write a Java program, you create variables, objects, and references all the time. Somewhere underneath all of that, memory is being allocated and freed constantly. If you do not understand how this works, you will eventually write code that leaks memory, causes surprising slowdowns, or crashes with cryptic errors like OutOfMemoryError or StackOverflowError.
This is also one of the most frequently tested topics in technical interviews. Interviewers use memory management questions to find out whether you understand how the JVM actually operates, not just how to write syntactically correct Java. They want to know: can you reason about what your code does at runtime? Can you diagnose a memory problem in production? This article builds that understanding from the ground up.
The good news is that Java manages memory automatically. You do not call free() like you would in C. But automatic does not mean invisible. The JVM makes very specific decisions about where to store your data and when to clean it up. Understanding those decisions helps you write better code and debug harder problems.
The JVM Splits RAM into Two Regions
When your Java program runs, the JVM takes a portion of your machine's RAM and divides it into two distinct regions: the Stack and the Heap. Everything that happens in your program happens inside one of these two regions. Understanding what goes where is the foundation of everything else in this topic.
Think of the Stack like a notepad on your desk. You write things down quickly, use them briefly, and then erase them when you are done. Think of the Heap like a filing cabinet in the corner of the room. Things go in there when they need to persist beyond a single moment. The notepad is fast and temporary. The filing cabinet is large and longer lived.
Stack Memory: Temporary, Ordered, Fast
The Stack is where Java stores temporary working data. Every time a method is called, the JVM creates a new block of memory on the Stack specifically for that method. This block is called a frame. The frame holds everything that method needs while it runs: its local variables, its parameters, and references to any objects it works with.
When the method finishes and returns, the JVM pops that frame off the Stack. Everything in it disappears instantly. No garbage collector needed, no cleanup pass. The memory is simply reclaimed the moment the frame is gone.
This is called LIFO: Last In, First Out. The most recently added frame is always the first one to be removed. If main() calls helper(), then helper() finishes first and its frame is popped, then main() finishes and its frame is popped.
Here is what the Stack stores:
Primitive data types are stored directly in the Stack frame. When you write int a = 10, the value 10 lives inside the frame for whatever method you wrote that line in.
References to objects are stored in the Stack. When you write Person p = new Person(), the variable p holds an address, a memory location that points somewhere in the Heap. The address itself lives in the Stack frame. The actual Person object lives in the Heap.
One critical thing to know: every thread has its own Stack. If your application runs three threads simultaneously, there are three separate Stacks, one for each thread. The threads do not share Stack memory. This is what makes local variables thread safe by default: no other thread can see your method's frame.
When Stack memory runs out (usually because of infinite or very deep recursion), the JVM throws StackOverflowError.
Heap Memory: Shared, Large, Managed by GC
The Heap is where all objects live. Every time you write new SomeThing(), the JVM allocates memory in the Heap for that object. The object stays there until no part of your program can reach it anymore, at which point the Garbage Collector can reclaim its memory.
Unlike the Stack, there is only one Heap per JVM instance. All threads share it. This is what allows threads to pass objects to each other: the object sits in the Heap, and multiple threads can hold references to it.
The Heap is generally much larger than the Stack. It is designed to hold many objects for long periods of time. When the Heap runs out of space and the Garbage Collector cannot free enough of it, the JVM throws OutOfMemoryError: Java heap space.
Stack vs Heap at a Glance
| Characteristic | Stack | Heap |
|---|---|---|
| What lives here | Primitive values, references, method frames | All objects created with new |
| One or many | One per thread | One shared by all threads |
| Lifetime | Until method returns (frame popped) | Until no references remain (GC cleans it) |
| Ordering | LIFO | No ordering, managed by GC |
| Error when full | StackOverflowError | OutOfMemoryError |
Tracing a Real Example Through Stack and Heap
The best way to truly understand Stack and Heap is to trace a real piece of code and watch exactly where each piece of data goes. Here is a simple example with two methods:
java
public class MemoryManagement {

    public static void main(String[] args) {
        int primitiveVar = 10;                    // primitive: stored in main's Stack frame
        Person personObj = new Person();          // Person object in Heap, personObj reference in Stack
        String stringLiteral = "24";             // "24" in String Constant Pool (inside Heap), reference in Stack
        MemoryManagement memObj = new MemoryManagement(); // MemoryManagement object in Heap, memObj reference in Stack

        memObj.memoryManagementTest(personObj);  // new Stack frame pushed for this call
        // after the call returns, control comes back here
    } // main's frame popped, all references in it are gone

    public void memoryManagementTest(Person personParam) {
        // personParam is a reference to the SAME Person object personObj pointed to in main
        Person personObj2 = personParam;          // personObj2 also points to the SAME Person object in Heap
        String stringLiteral2 = "24";            // "24" already exists in the Pool, reuses it, no new object created
        String stringObj3 = new String("24");    // new String object in Heap (OUTSIDE the Pool, separate object)
    } // this frame is popped first (LIFO), personParam, personObj2, stringLiteral2, stringObj3 references are gone

}
Let us walk through this step by step and see exactly what happens in memory.
Step 1: main is called. The JVM pushes a new frame onto the Stack for main. This frame will hold everything created inside main.
Step 2: primitiveVar = 10 is executed. The value 10 is stored directly inside main's frame on the Stack. No Heap involved.
Step 3: new Person() is executed. A Person object is created in the Heap. The variable personObj holds the address of that object, and that address lives inside main's frame on the Stack.
Step 4: "24" is assigned to stringLiteral. String literals go into a special area called the String Constant Pool, which lives inside the Heap. The Pool stores each unique string value exactly once. The variable stringLiteral in main's frame holds a reference to "24" in the Pool.
Step 5: new MemoryManagement() is executed. Another object lands in the Heap. memObj in main's frame holds a reference to it.
Step 6: memObj.memoryManagementTest(personObj) is called. The JVM pushes a brand new frame onto the Stack for memoryManagementTest. This frame exists on top of main's frame.
Step 7: Inside memoryManagementTest, personParam receives the same address that personObj held. Both now point to the exact same Person object in the Heap. No new Person object is created.
Step 8: personObj2 = personParam creates yet another reference variable in the frame, also pointing to the same Person object. One object in the Heap, now three references to it.
Step 9: stringLiteral2 = "24" is evaluated. The JVM checks the String Constant Pool. "24" is already there. It reuses it. No new object created. stringLiteral2 just holds another reference to the same pooled string.
Step 10: new String("24") creates a brand new String object in the Heap, outside the Pool. Even though its content is "24", it is a separate object. stringObj3 holds a reference to this new object.
Step 11: The closing brace of memoryManagementTest is reached. The frame for that method is popped off the Stack (LIFO: it was the last one added, so it is the first removed). The variables personParam, personObj2, stringLiteral2, and stringObj3 are all gone. The references are destroyed. But the Person object in the Heap? It still exists. The MemoryManagement object? Still exists. The String objects? Still exist. Popping a Stack frame does not destroy Heap objects.
Step 12: main's closing brace is reached. main's frame is popped. The references personObj, stringLiteral, and memObj are gone.
Step 13: Now the Heap contains objects that no Stack frame holds a reference to anymore. The Person object, the MemoryManagement object, the new String("24") object: all orphaned. This is where the Garbage Collector comes in.
The String Constant Pool
The String Constant Pool is a special section inside the Heap where the JVM stores string literals. When you write "hello" anywhere in your code, the JVM puts "hello" into the Pool the first time it sees it. The next time anything anywhere in your program uses "hello", the JVM checks the Pool, finds it already there, and hands back a reference to the existing copy.
This is why two string literals with the same content point to the same object, while two strings created with new String(...) do not:
java
String a = "hello";           // stored in String Constant Pool
String b = "hello";           // reuses the same "hello" from the Pool
String c = new String("hello"); // brand new object in Heap, outside the Pool

System.out.println(a == b);   // true: same reference, same object in Pool
System.out.println(a == c);   // false: different objects in memory
System.out.println(a.equals(c)); // true: same content
The == operator compares memory addresses, so a == b is true because they point to the same pooled object. a == c is false because c points to a separate Heap object created with new. This is why you should always use .equals() to compare string content, never ==.
Since Java 7, the String Constant Pool lives in the Heap. Before that, it lived in a different region called PermGen. The move to Heap means the Pool can be garbage collected when strings are no longer referenced.
Garbage Collection: Automated Memory Cleanup
In languages like C, you allocate memory and then you are responsible for freeing it. Forget to free it, and it leaks. Java removes that burden. The Garbage Collector runs in the background and cleans up objects that are no longer reachable.
An object becomes eligible for garbage collection when no active thread can reach it through any chain of references. The simplest way this happens is when you set a reference to null:
java
Person p = new Person();   // Person object created in Heap, p holds reference
p = null;                  // p no longer points to the Person object
                           // Person object is now unreachable, eligible for GC
Another common way is when a reference is overwritten:
java
Person obj1 = new Person();     // obj1 points to Person object A
Person obj2 = new Person();     // obj2 points to Person object B
obj1 = obj2;                    // obj1 now points to Person object B
                                // Person object A has no references, eligible for GC
The JVM decides when to run the Garbage Collector. You can hint at it with System.gc(), but the JVM is free to ignore that hint completely. There is no guarantee GC will run when you call it:
java
System.gc(); // a suggestion, NOT a command. JVM may or may not honor it.Never design code that depends on System.gc() running at a specific moment. This is a common mistake. The JVM monitors Heap usage on its own and runs GC when it decides the time is right: typically when a memory region starts filling up.
GC Roots and Reachability
The Garbage Collector does not randomly delete objects. It starts from a set of well known starting points called GC roots and traces all the objects reachable from them. If an object can be reached by following references from a GC root, it is alive. If it cannot be reached from any GC root by any path, it is dead and eligible for collection.
GC roots include the Stack frames of all currently running threads (which hold local variable references), static fields in loaded classes, and some JVM internal references. Everything reachable from those starting points survives. Everything else gets collected.
This is why setting a reference to null makes an object eligible: you break the chain of references from a GC root to that object. When the GC traces from its roots and can no longer reach the object, it marks it for deletion.
Different Types of References
Most Java code uses what is called a strong reference. This is simply the normal way you assign an object to a variable. A strong reference tells the GC: do not collect this object while I exist.
java
Person p = new Person(); // strong reference, GC will never collect this while p is aliveJava also provides weaker forms of reference for specific use cases.
A weak reference tells the GC: collect this object on the very next GC run, even if I still exist. You access the value with .get(), which may return null if the GC has already collected it:
java
import java.lang.ref.WeakReference;

WeakReference<Person> weakRef = new WeakReference<>(new Person("Alice"));
// ... time passes, GC runs ...
Person p = weakRef.get(); // might return null if GC has collected the Person object
if (p != null) {
    // safe to use p here
}
Weak references are useful for caches where you want entries to disappear automatically when no other code is holding onto them. WeakHashMap in the standard library uses this pattern.
A soft reference is like a weak reference, but with more patience. It tells the GC: you are allowed to collect this object, but only if you are truly running out of memory. As long as there is space available, keep it alive. Soft references are ideal for memory sensitive caches where you want entries to stay as long as possible but not cause an OutOfMemoryError:
java
import java.lang.ref.SoftReference;

SoftReference<byte[]> cache = new SoftReference<>(loadExpensiveData());
// data will survive as long as memory is plentiful
// GC may collect it only under memory pressure
There is also a phantom reference, which is more advanced. It gets enqueued after the object has been finalized but before its memory is actually reclaimed. It is used for more sophisticated cleanup scenarios. In interviews, simply being able to name it and describe roughly what it is will serve you well.
In practice at most companies, you will almost always use strong references. The other types exist for specific caching and resource management scenarios.
The Heap Is Divided into Generations
Objects do not all live and die at the same rate. Most objects are created, used briefly, and then abandoned within milliseconds: a loop variable, a temporary result, a request object in a web server. A small number of objects live for the entire lifetime of the application: a configuration holder, a singleton service, a connection pool.
The JVM exploits this observation with generational garbage collection. Instead of scanning the entire Heap every time it needs to collect garbage, it divides the Heap into regions and collects the younger, shorter lived regions much more frequently. This makes GC dramatically faster on average.
The Heap is divided into two main regions: the Young Generation and the Old Generation (also called the Tenured Generation).
The Young Generation is further split into three spaces: Eden, Survivor 0 (S0), and Survivor 1 (S1).
There is also a separate nonheap region called Metaspace (previously called PermGen in older Java versions).
+--------------------------------------------------+
|                   Young Generation               |
|  +----------+  +-------------+  +-------------+  |
|  |  Eden    |  | Survivor 0  |  | Survivor 1  |  |
|  +----------+  +-------------+  +-------------+  |
+--------------------------------------------------+
|                   Old Generation (Tenured)        |
|  +----------------------------------------------+ |
|  |   Long-lived objects promoted from Young     | |
|  +----------------------------------------------+ |
+--------------------------------------------------+

  Outside the Heap:
  +-------------------------------------------+
  | Metaspace: class metadata, static vars,   |
  | constants, class info                     |
  +-------------------------------------------+
Eden: Where Every Object Begins
Every object you create starts life in Eden. Eden is relatively small and fills up quickly because your program creates objects constantly.
Survivor Spaces: S0 and S1
These two spaces act as a holding area for objects that survive their first GC cycle but are not old enough to be promoted to the Old Generation. At any point in time, one survivor space is in use and one is completely empty. They alternate with each GC cycle.
Old Generation: For Long Lived Objects
Objects that survive enough GC cycles graduate here. Once in the Old Generation, an object is assumed to be long lived. GC runs less frequently here, but when it does run, it takes longer.
Minor GC: Cleaning the Young Generation
When Eden fills up, the JVM triggers a Minor GC. Minor GC only operates on the Young Generation. Because the Young Generation is small and most objects in it are already dead by the time GC runs, Minor GC is fast.
Here is how it works step by step:
Mark: The GC traces from GC roots and marks every object in the Young Generation that is still reachable. Unreachable objects are identified for deletion.
Sweep: Unmarked objects are deleted. Their memory is freed.
Copy and age: Surviving objects from Eden are moved to one of the Survivor spaces (say S0). Their age counter is incremented by 1. Previously surviving objects in S1 are also moved to S0, and their age counters are incremented too.
After Minor GC: Eden is empty and ready for new objects. One of the Survivor spaces (S0) holds all survivors. The other (S1) is empty.
The next time Minor GC runs, survivors from Eden and from S0 are moved to S1, and their ages are incremented again. S0 becomes the empty one. This alternation continues with every GC cycle.
Promotion: Each object has an age counter. Every Minor GC that an object survives adds one to its age. When the age counter crosses a threshold (the default is 15), the object is promoted to the Old Generation. It has proven that it lives a long time, so keeping it in the Young Generation wastes GC time scanning it repeatedly.
Major GC: Cleaning the Old Generation
When the Old Generation fills up, the JVM triggers a Major GC (sometimes called Full GC). This operates on the Old Generation and is significantly slower than Minor GC for two reasons.
First, the Old Generation is large. It contains objects that have been alive a long time, which means they have survived many GC cycles and accumulated many references pointing to them and from them. Tracing all those references takes time.
Second, Old Generation GC runs much less frequently. Where Minor GC might run every few seconds, Major GC might run only every few minutes or even less. But when it runs, it must scan and process much more data.
The process is the same: mark reachable objects, sweep the unreachable ones, and compact the survivors.
Compaction: Defragmenting the Heap
After deleting objects, the remaining live objects may be scattered through memory with gaps between them. This fragmentation is a problem: when you need to allocate a large new object, there may not be a single contiguous free block large enough, even if total free memory is sufficient.
Compaction solves this. After sweeping, the GC slides all surviving objects together to form one contiguous block of live data followed by one contiguous free region. New allocations can then happen efficiently at the end of the used region.
Stop the World: The Performance Cost of GC
Here is the thing that matters most for application performance. When the Garbage Collector runs, it needs a stable snapshot of which objects are reachable. If objects are being created and references are being changed while the GC is tracing, the GC might make incorrect decisions. So most GC implementations pause all application threads while they work.
This pause is called a stop the world pause. Your application freezes. No requests are processed. No data is written. Everything waits until the GC finishes. Then all threads resume.
For Minor GC, stop the world pauses are short because the Young Generation is small and collection is fast.
For Major GC, stop the world pauses can be long. If your Old Generation contains gigabytes of data, the GC may pause your application for hundreds of milliseconds or even seconds. For a web server handling thousands of requests per second, a one second pause is catastrophic.
This is why reducing GC pause time is so important in high performance applications.
When pause time decreases, your throughput increases. If your application could process 1000 requests per minute with frequent long pauses, reducing those pauses might let it process 1500 requests per minute. And your latency improves too: users no longer experience those sudden slowdowns when GC kicks in.
The Four Garbage Collectors
The JVM comes with several GC implementations, each making different tradeoffs:
Serial GC: Uses a single thread to do all GC work. When GC runs, one thread does everything while all application threads pause. It is simple and has low overhead, but pauses are long and it cannot take advantage of multiple CPU cores. Suitable only for small applications or single core environments.
Parallel GC: Uses multiple GC threads, typically one per CPU core. All application threads still pause during collection, but with multiple GC threads working simultaneously, the collection finishes faster, so pauses are shorter. This was the default in Java 8.
CMS (Concurrent Mark Sweep): Attempts to do most of its work concurrently with your application threads, so your application does not have to fully pause. The JVM does not guarantee zero pauses, but it tries hard to minimize them. The downside: CMS does not compact the Heap after collection. Over time, memory fragmentation accumulates. CMS was deprecated in Java 9 and removed later.
G1 (Garbage First): The default since Java 9. G1 divides the entire Heap into many equal sized regions (not strict Young/Old boundaries like the others). It prioritizes collecting regions with the most garbage first (hence "Garbage First"), which gives more predictable pause times. It runs concurrently with application threads and does perform compaction. For most production applications, G1 is the right choice.
A common interview question: what is the default GC in Java 8? Parallel GC. In Java 9 and later? G1 GC.
Metaspace: Where Class Information Lives
Outside the Heap, the JVM maintains a region called Metaspace. This is where it stores:
Class metadata: the structural information about every loaded class (its fields, methods, bytecode, hierarchy).
Static variables: all variables declared with the static keyword belong to the class, not to any particular object, so they live here.
Constants: values declared as static final.
Before Java 8, this region was called PermGen (Permanent Generation) and it was part of the Heap with a fixed maximum size. When too many classes were loaded, PermGen would fill up and the JVM would throw OutOfMemoryError: PermGen space. This was a frequent problem with application servers that hot reloaded many classes.
Java 8 replaced PermGen with Metaspace. Metaspace lives in native memory (outside the Java Heap), so it is not constrained by Heap size. It grows automatically as needed. If a class is unloaded, its metadata in Metaspace is freed. This eliminates the PermGen out of memory problem under normal circumstances.
Memory Leaks in Java
Java cannot leak memory the way C can, where you allocate and then forget to free. But Java can absolutely leak memory through inadvertently holding references to objects that should no longer be alive.
The classic Java memory leak: a static collection that grows without bound.
java
public class Server {
    // This list is static, lives as long as the class is loaded
    // If you keep adding to it and never remove items,
    // it will grow until you run out of heap
    static List<Request> requestLog = new ArrayList<>();

    public void handleRequest(Request req) {
        requestLog.add(req);  // adding but never removing = memory leak
        // ... process req ...
    }
}
Other common sources of memory leaks in Java:
Event listeners that are registered but never removed. If your object registers itself as a listener on another object, and that listener is never deregistered, the other object holds a reference to yours and prevents it from being collected.
Caches that never evict. A cache that adds entries but never expires or removes old ones grows indefinitely.
Inner class references. A nonstatic inner class holds an implicit reference to its outer class instance. If you hold a reference to an inner class object, you indirectly hold a reference to the outer object.
The symptom of a memory leak is that your application's Heap usage grows steadily over time, and GC cannot free it because there are still live references (even if those references serve no useful purpose to your program's logic).
The finalize() Method: Do Not Rely on It
Java provides a method called finalize() on every object. You can override it to run cleanup code before the object is garbage collected:
java
public class Resource {
    @Override
    protected void finalize() throws Throwable {
        // cleanup code here
        super.finalize();
    }
}
This looks useful: a hook that runs when the object is about to be destroyed. In practice, you should never rely on it.
The GC does not guarantee when finalize() will be called. It might run immediately. It might run hours later. It might never run at all in some implementations. If you are waiting for finalize() to close a file or release a database connection, you may hold that resource open for an arbitrarily long time.
Even worse, calling finalize() adds overhead to the GC process. Objects with finalize() methods require extra work before they can be collected.
The correct approach for cleanup is to implement AutoCloseable and use a try with resources block, or call cleanup methods explicitly. finalize() was deprecated in Java 9 and removed in Java 18.
Common Memory Errors and What Causes Them
StackOverflowError: The Stack for a thread ran out of space. The most common cause is infinite recursion: a method calls itself without a base case, and each call pushes a new frame until the Stack is full.
java
public void infinite() {
    infinite(); // no base case, Stack fills up, StackOverflowError thrown
}
Very deep (but not infinite) recursion can also cause this if the stack frames are large. The fix is to rewrite the recursive algorithm iteratively, or restructure the code to reduce recursion depth.
OutOfMemoryError: Java heap space: The Heap is full and GC cannot reclaim enough space. Either you have a genuine memory leak (objects held alive unintentionally), or you simply have more live data than your configured Heap can hold. The fix is to either find and eliminate the leak, or increase the Heap size with JVM flags like -Xmx.
OutOfMemoryError: Metaspace: Too many classes are loaded and Metaspace is full. This can happen with dynamic class generation frameworks or applications that reload classes many times. You can increase the Metaspace limit with -XX:MaxMetaspaceSize.
Mark and Sweep: The Core Algorithm
All the GC implementations described above are built on top of a fundamental algorithm called mark and sweep. Understanding it helps you understand why GC behaves the way it does.
Mark phase: Starting from GC roots, the GC traces all reachable objects and marks them as alive. Objects not reached are unmarked, meaning they are dead.
Sweep phase: The GC scans through memory. Unmarked objects are deleted, and their memory is freed.
Compaction phase (in implementations that support it): The GC moves all surviving objects together, eliminating the gaps left by deleted objects. This creates one large contiguous free region for future allocations.
Without compaction, the Heap becomes fragmented over time. You might have 100 MB of free memory spread across thousands of tiny gaps, but be unable to allocate a 50 MB object because no single gap is large enough.
The Complete Interview Checklist
These are the questions that come up in interviews about Java memory management. Make sure you can answer every one of them clearly.
Where do primitives and objects live? Primitive values live in Stack frames (for local variables) or directly inside objects on the Heap (for instance fields). Objects created with new always live in the Heap.
Is there one Stack or many? One Stack per thread. One Heap shared across all threads.
What is the String Constant Pool? A special section of the Heap where string literals are stored. Each unique string value is stored once, and all literal references to the same value point to the same pooled object. Since Java 7 it lives in the Heap (before that it was in PermGen).
When is an object eligible for GC? When no strong reference from any GC root can reach it.
What does System.gc() do? It suggests to the JVM that now would be a good time to run GC. The JVM may ignore it. No guarantees.
What is the difference between strong, weak, and soft references? Strong: GC never collects the object while the reference exists. Weak: GC collects the object on the next run regardless of available memory. Soft: GC collects only under severe memory pressure.
What are the Young Generation regions? Eden, Survivor 0, and Survivor 1.
What is Minor GC? GC that runs on the Young Generation. Fast and frequent.
What is Major GC? GC that runs on the Old Generation. Slow and infrequent.
How do objects move from Young to Old Generation? Each Minor GC that an object survives increments its age counter. When the age crosses a threshold (default 15), the object is promoted to the Old Generation.
What is stop the world? When GC runs, all application threads pause until GC is done. Longer pauses mean lower throughput and higher latency.
What replaced PermGen? Metaspace, introduced in Java 8. It is outside the Heap, in native memory, and expands automatically.
What is the default GC in Java 8? Parallel GC. In Java 9 and later? G1 GC.
What is G1 GC? Garbage First GC. It divides the Heap into equal sized regions, collects the highest garbage regions first, runs concurrently with application threads, and performs compaction. The default since Java 9.
What is a Java memory leak? Holding references to objects that should no longer be alive, preventing GC from collecting them. Common causes: growing static collections, unregistered listeners, unbounded caches.
Should you use finalize()? No. The timing of its execution is not guaranteed. Use AutoCloseable and try with resources instead.
What errors indicate memory problems? StackOverflowError for stack exhaustion (usually infinite recursion). OutOfMemoryError: Java heap space for Heap exhaustion (usually a memory leak or insufficient Heap size).
Putting It All Together
When you run a Java program, the JVM gives you two main memory regions. The Stack, one per thread, manages method calls through frames that are pushed and popped in LIFO order. Primitives and references live here temporarily. The Heap, shared across all threads, holds every object created with new. Objects live there until no reference connects them to any GC root.
The Heap is divided into Young and Old generations. New objects are born in Eden. Survivors of Minor GC bounce between the two Survivor spaces, gaining age with each survival. At age threshold, they are promoted to the Old Generation. Major GC eventually cleans the Old Generation, but it is slower and more expensive.
The Garbage Collector automates memory cleanup. It traces from GC roots, marks reachable objects as alive, sweeps unreachable ones, and optionally compacts the survivors. Different GC implementations (Serial, Parallel, CMS, G1) trade off throughput, pause time, and memory usage. G1 is the modern default and the right choice for most applications.
Understanding all of this is not just about passing interviews. It is about being able to look at an OutOfMemoryError in a production log and know where to start looking. It is about writing code that does not silently accumulate objects until your server falls over at 3am. It is about understanding the system your code runs in, not just the syntax you write.